
Analytics for Your AI Support Chatbot.
Analytics shows conversations, leads, messages, conversion rate, and trends over time, plus usage meters — see what your AI support is actually doing.
3-day free trial · Monthly or annual billing · Cancel anytime
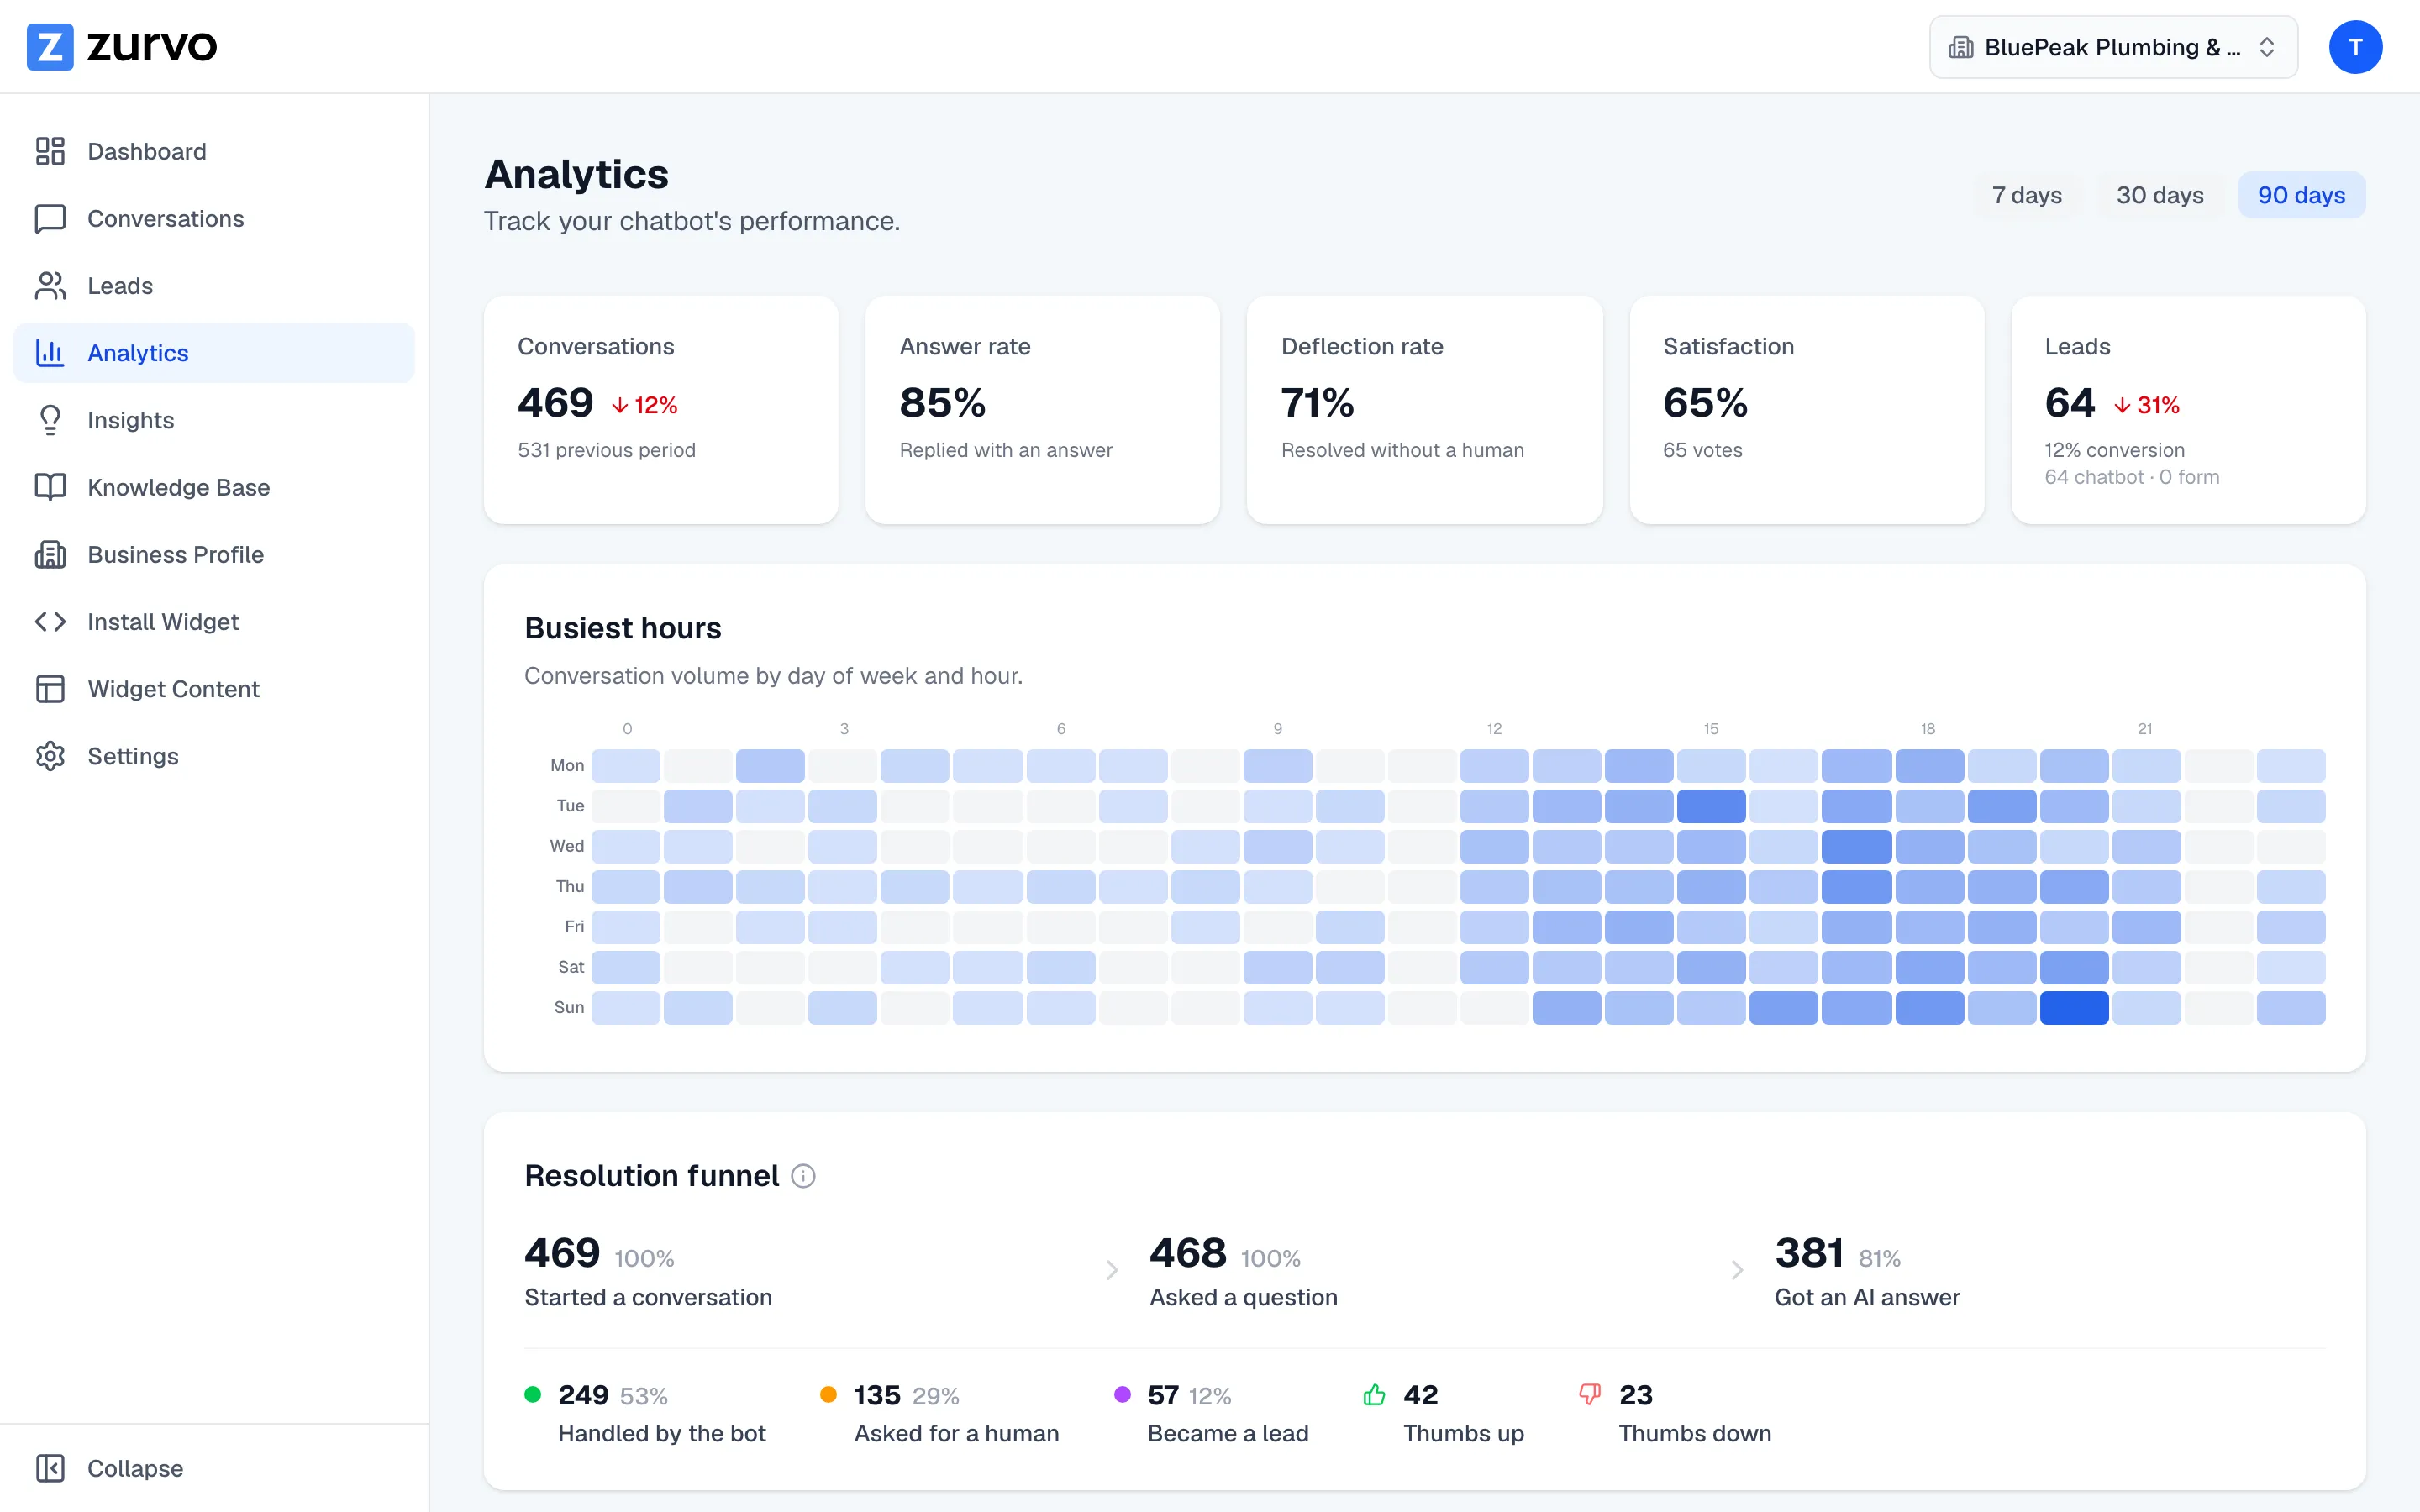
The metrics that matter
The scoreboard for your chatbot.
Zurvo gives you the numbers that matter for AI support, trended over the period you choose. Because the chatbot answers from your content and every conversation is recorded, these reflect what actually happened — not a vanity dashboard.
- Conversations: the raw volume of demand absorbed
- Leads captured: visitors who became named prospects
- Messages and conversion rate (leads ÷ conversations)
Trends, not snapshots
A number over time tells a story.
A number on its own tells you little; a number over time tells you where the funnel is moving. Load metrics for the period you select and compare a recent window against a longer stretch.
- Rising conversations, flat conversion = the ask isn't landing
- Rising conversion = your changes are working
- The trend is where the decisions are
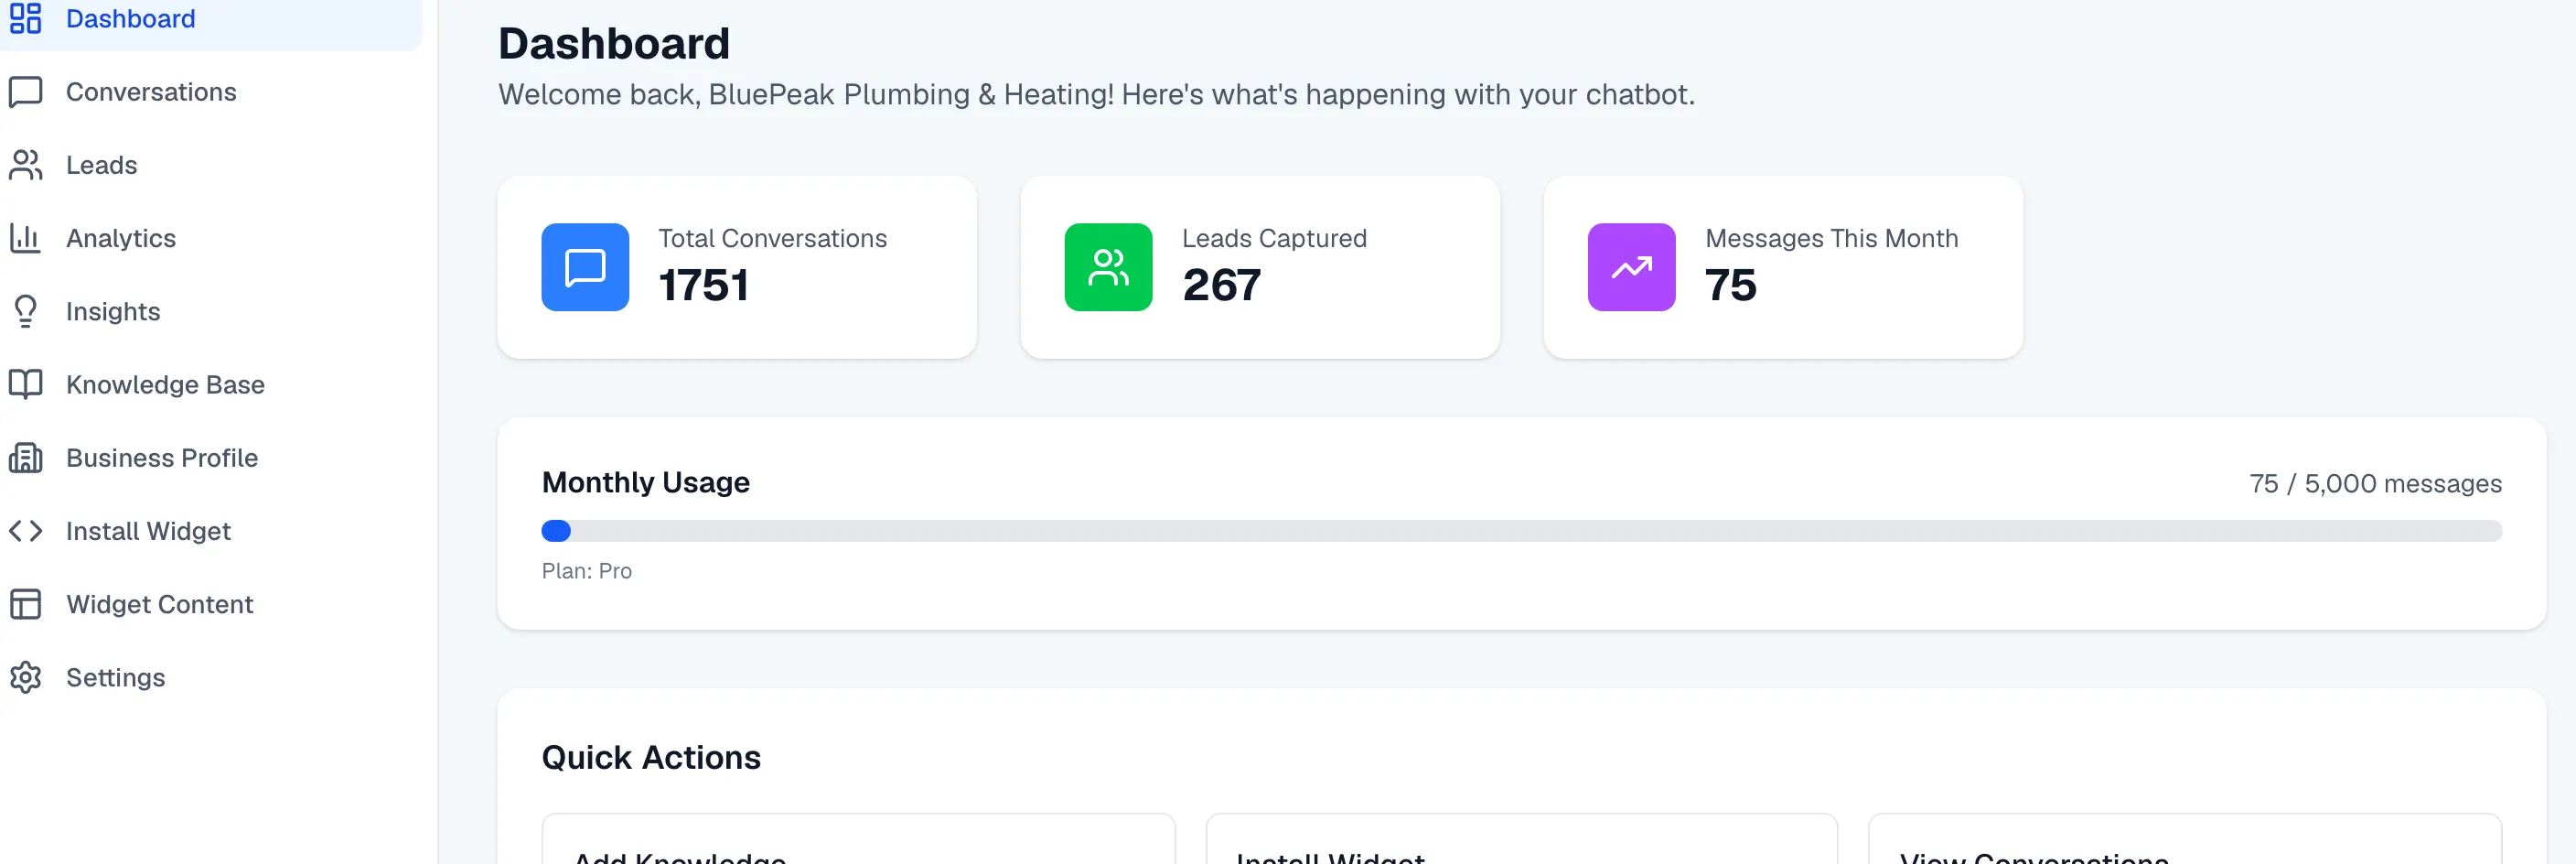
Usage meters
See where you stand against your plan.
Your dashboard shows usage meters — like messages this month — so consumption is visible rather than a surprise. You can see when you're approaching a limit and decide whether to move up a tier before you hit it.
- Consumption tracked against your tier
- No opaque end-of-month surprise
- See pricing for what each plan includes
From numbers to decisions
Read it in a minute, act on it.
Metrics only earn their keep when they change what you do. The dashboard is built so a busy owner can read it in a minute and know the one thing worth doing next.
- Conversion flat while conversations climb → tune the greeting and lead form
- Messages spiking without more conversations → check AI Insights
- Leads flat while conversations rise → revisit the proactive form
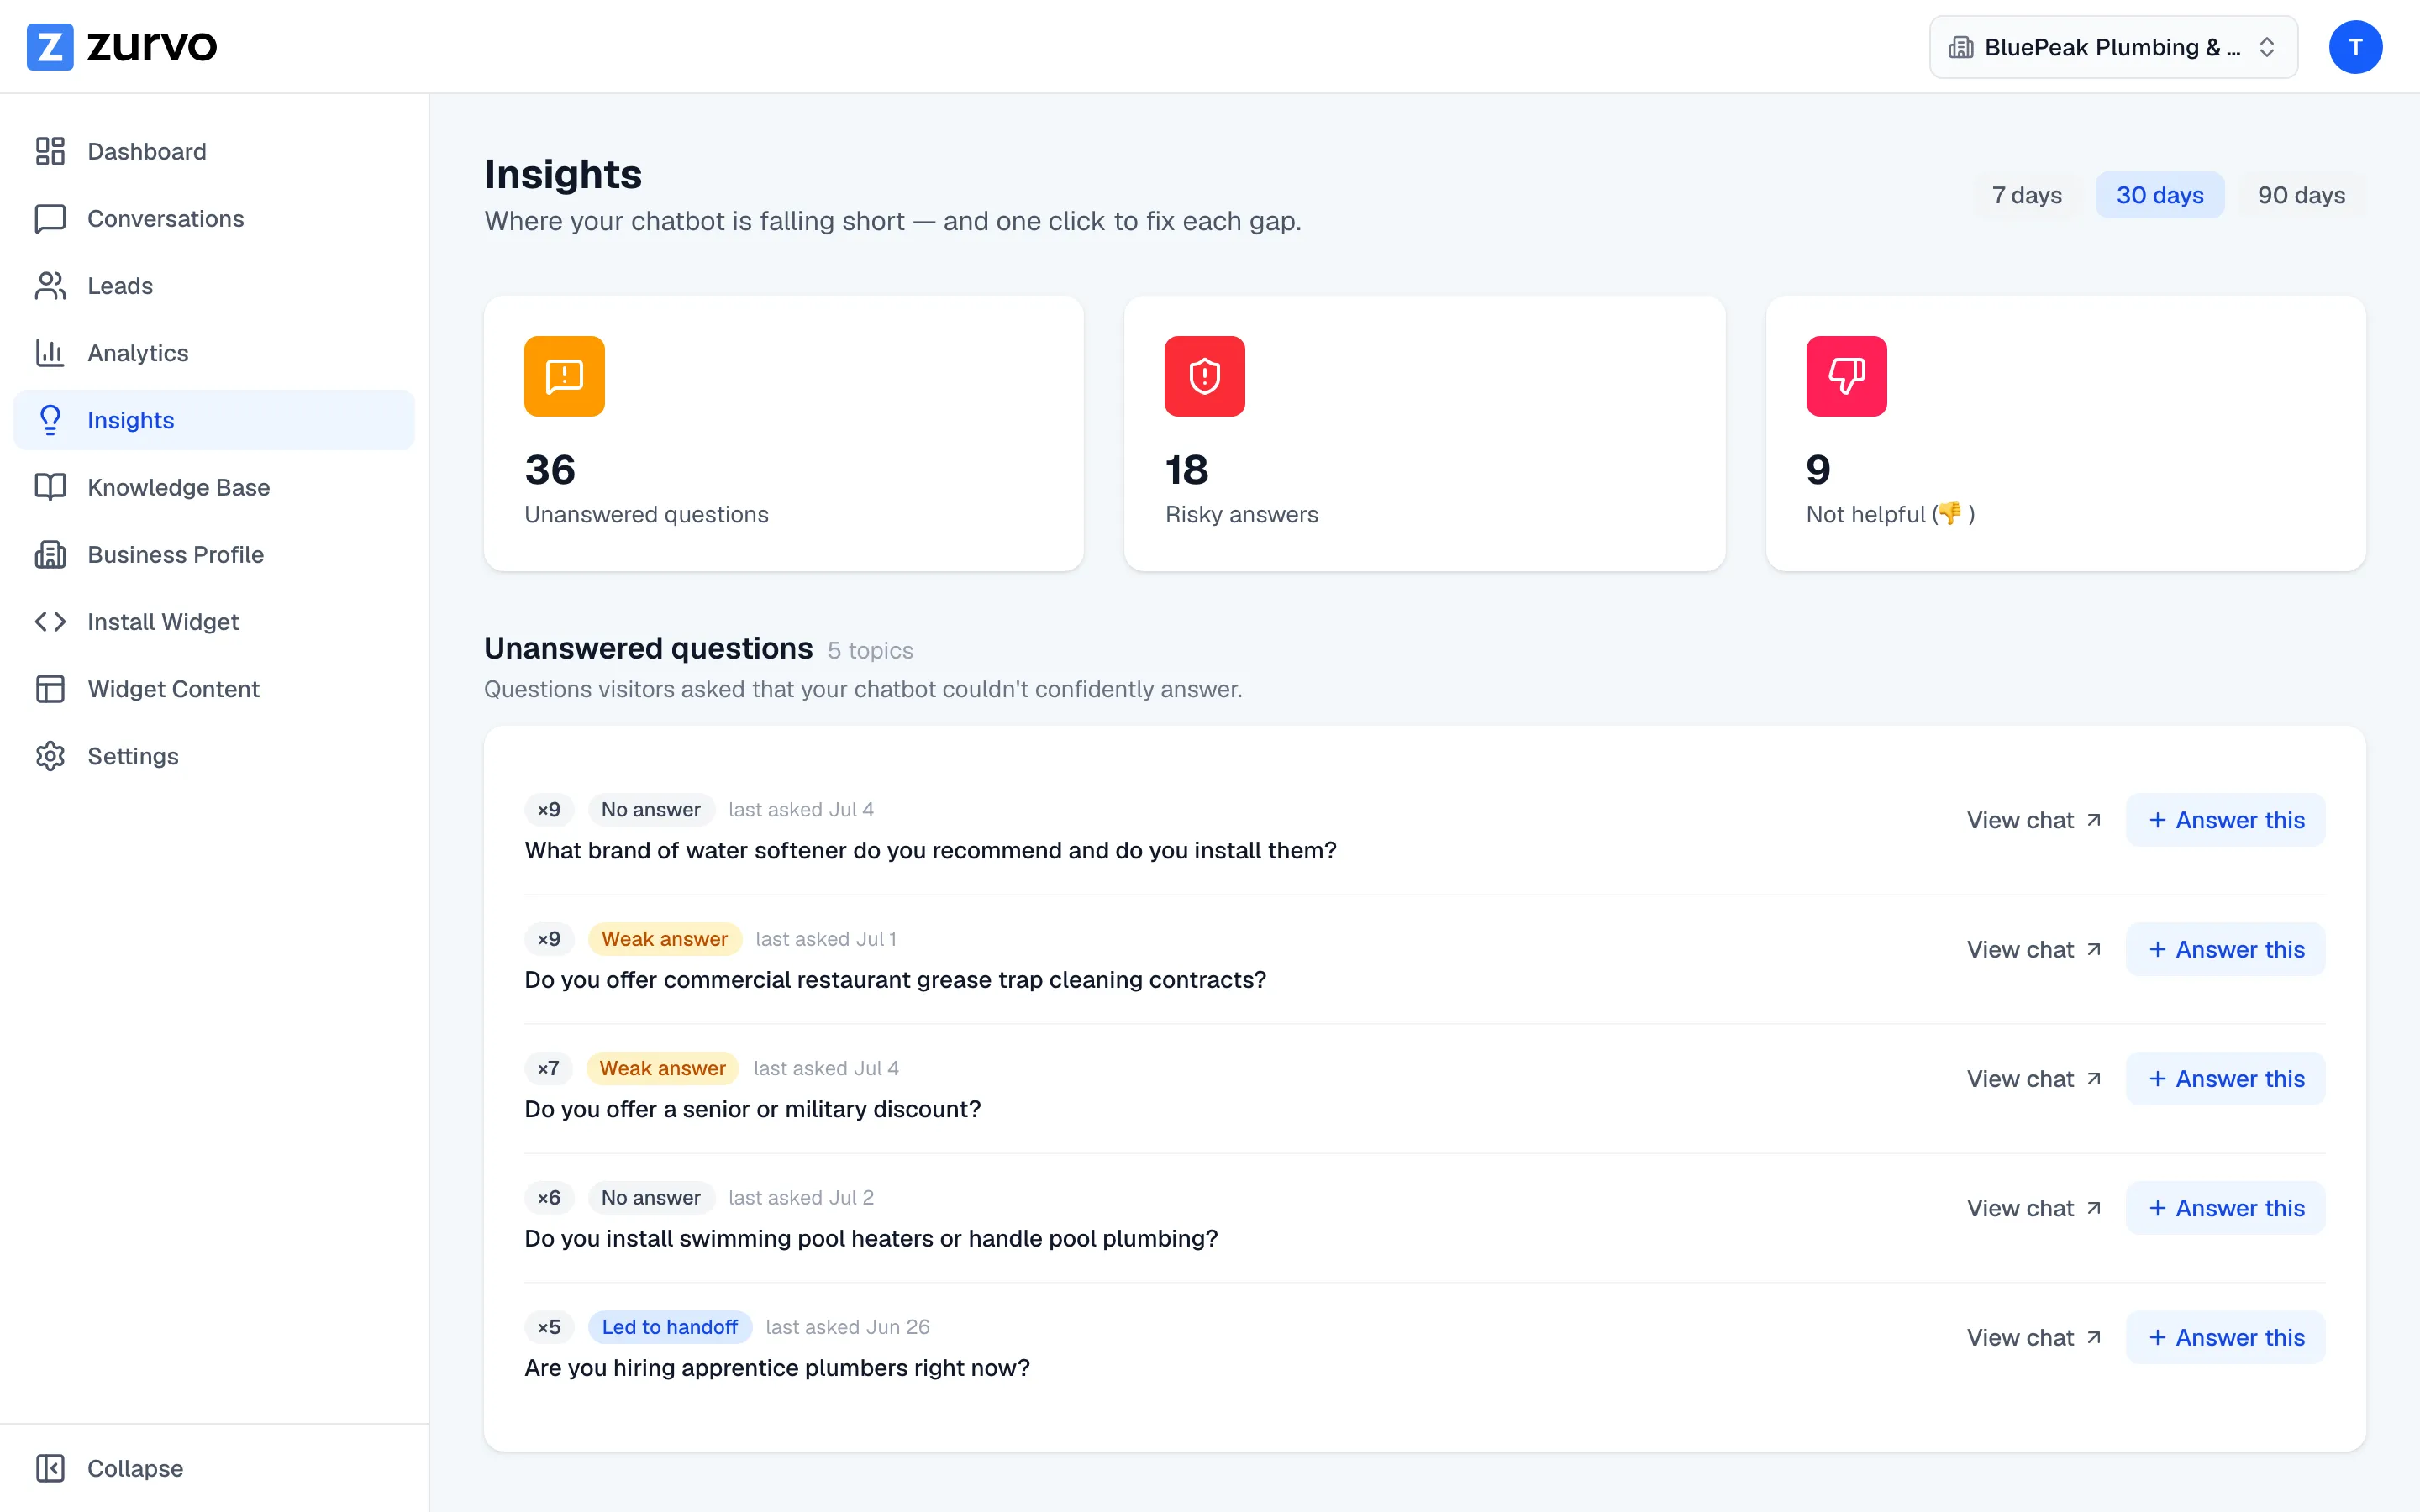
Analytics is the scoreboard for your AI support — conversations, leads, messages, and conversion, trended over any period, plus usage meters against your plan. Because the chatbot answers from your own content and every conversation is recorded, the numbers reflect what actually happened rather than a vanity dashboard.
Pair it with AI Insights to turn the numbers into fixes: analytics tells you the score is slipping, Insights tells you which content gaps to close. Included on every plan — see pricing or try it live.
Frequently asked questions.
What does the analytics dashboard show?
The core metrics of your AI support: total conversations, leads captured, messages, and conversion rate (leads as a share of conversations), plus how each trends over the period you select. It's the scoreboard for what your chatbot is doing.
How is conversion rate calculated?
Conversion rate is leads captured divided by conversations, shown as a percentage for the selected period — a simple read on how effectively your chat traffic is turning into leads.
Can I filter by time period?
Yes. Metrics load for the period you select, so you can look at a recent window or a longer trend and compare how the numbers are moving.
What are the usage meters?
Your dashboard shows usage against your plan — like messages this month — so you can see where you stand relative to your limits and whether it's time to move up a tier. See pricing for what each plan includes.
How is this different from AI Insights?
Analytics answers how much — volume, conversion, trends. AI Insights answers what to fix — the specific questions your content couldn't answer. Analytics is the scoreboard; AI Insights is the to-do list. Use them together.
How do I turn these numbers into decisions?
A few common reads: conversations climbing but conversion flat usually means a prompting or lead-form issue — tune the greeting and form trigger. Conversion climbing means your changes are landing. Messages spiking without more conversations means conversations are getting longer — check AI Insights. Leads flat while conversations rise means revisit whether the proactive form is enabled. None of this requires a data team.
Who on my team can see analytics?
Access follows your roles and permissions: support leaders watch resolution and conversion, and viewers can be granted analytics access without touching conversations. See Security and Control.
Is this a full BI suite?
No. Analytics is a support and lead dashboard with the metrics that matter for AI support out of the box, not a custom query builder. It measures rather than diagnoses — a dip in conversion is a signal, and AI Insights plus conversation review tell you why. The numbers reflect your traffic, so a quiet chatbot produces a quiet dashboard.
Turn your website into your best support agent.
Train Zurvo on your content, answer customers with citations, and hand off to your team when it counts.
3-day free trial · Monthly or annual billing · Cancel anytime