
Read your analytics overview.
Track how your chatbot is doing with the Analytics page — conversations, answer and deflection rates, satisfaction, leads and conversion, plus charts over 7, 30, or 90 days.
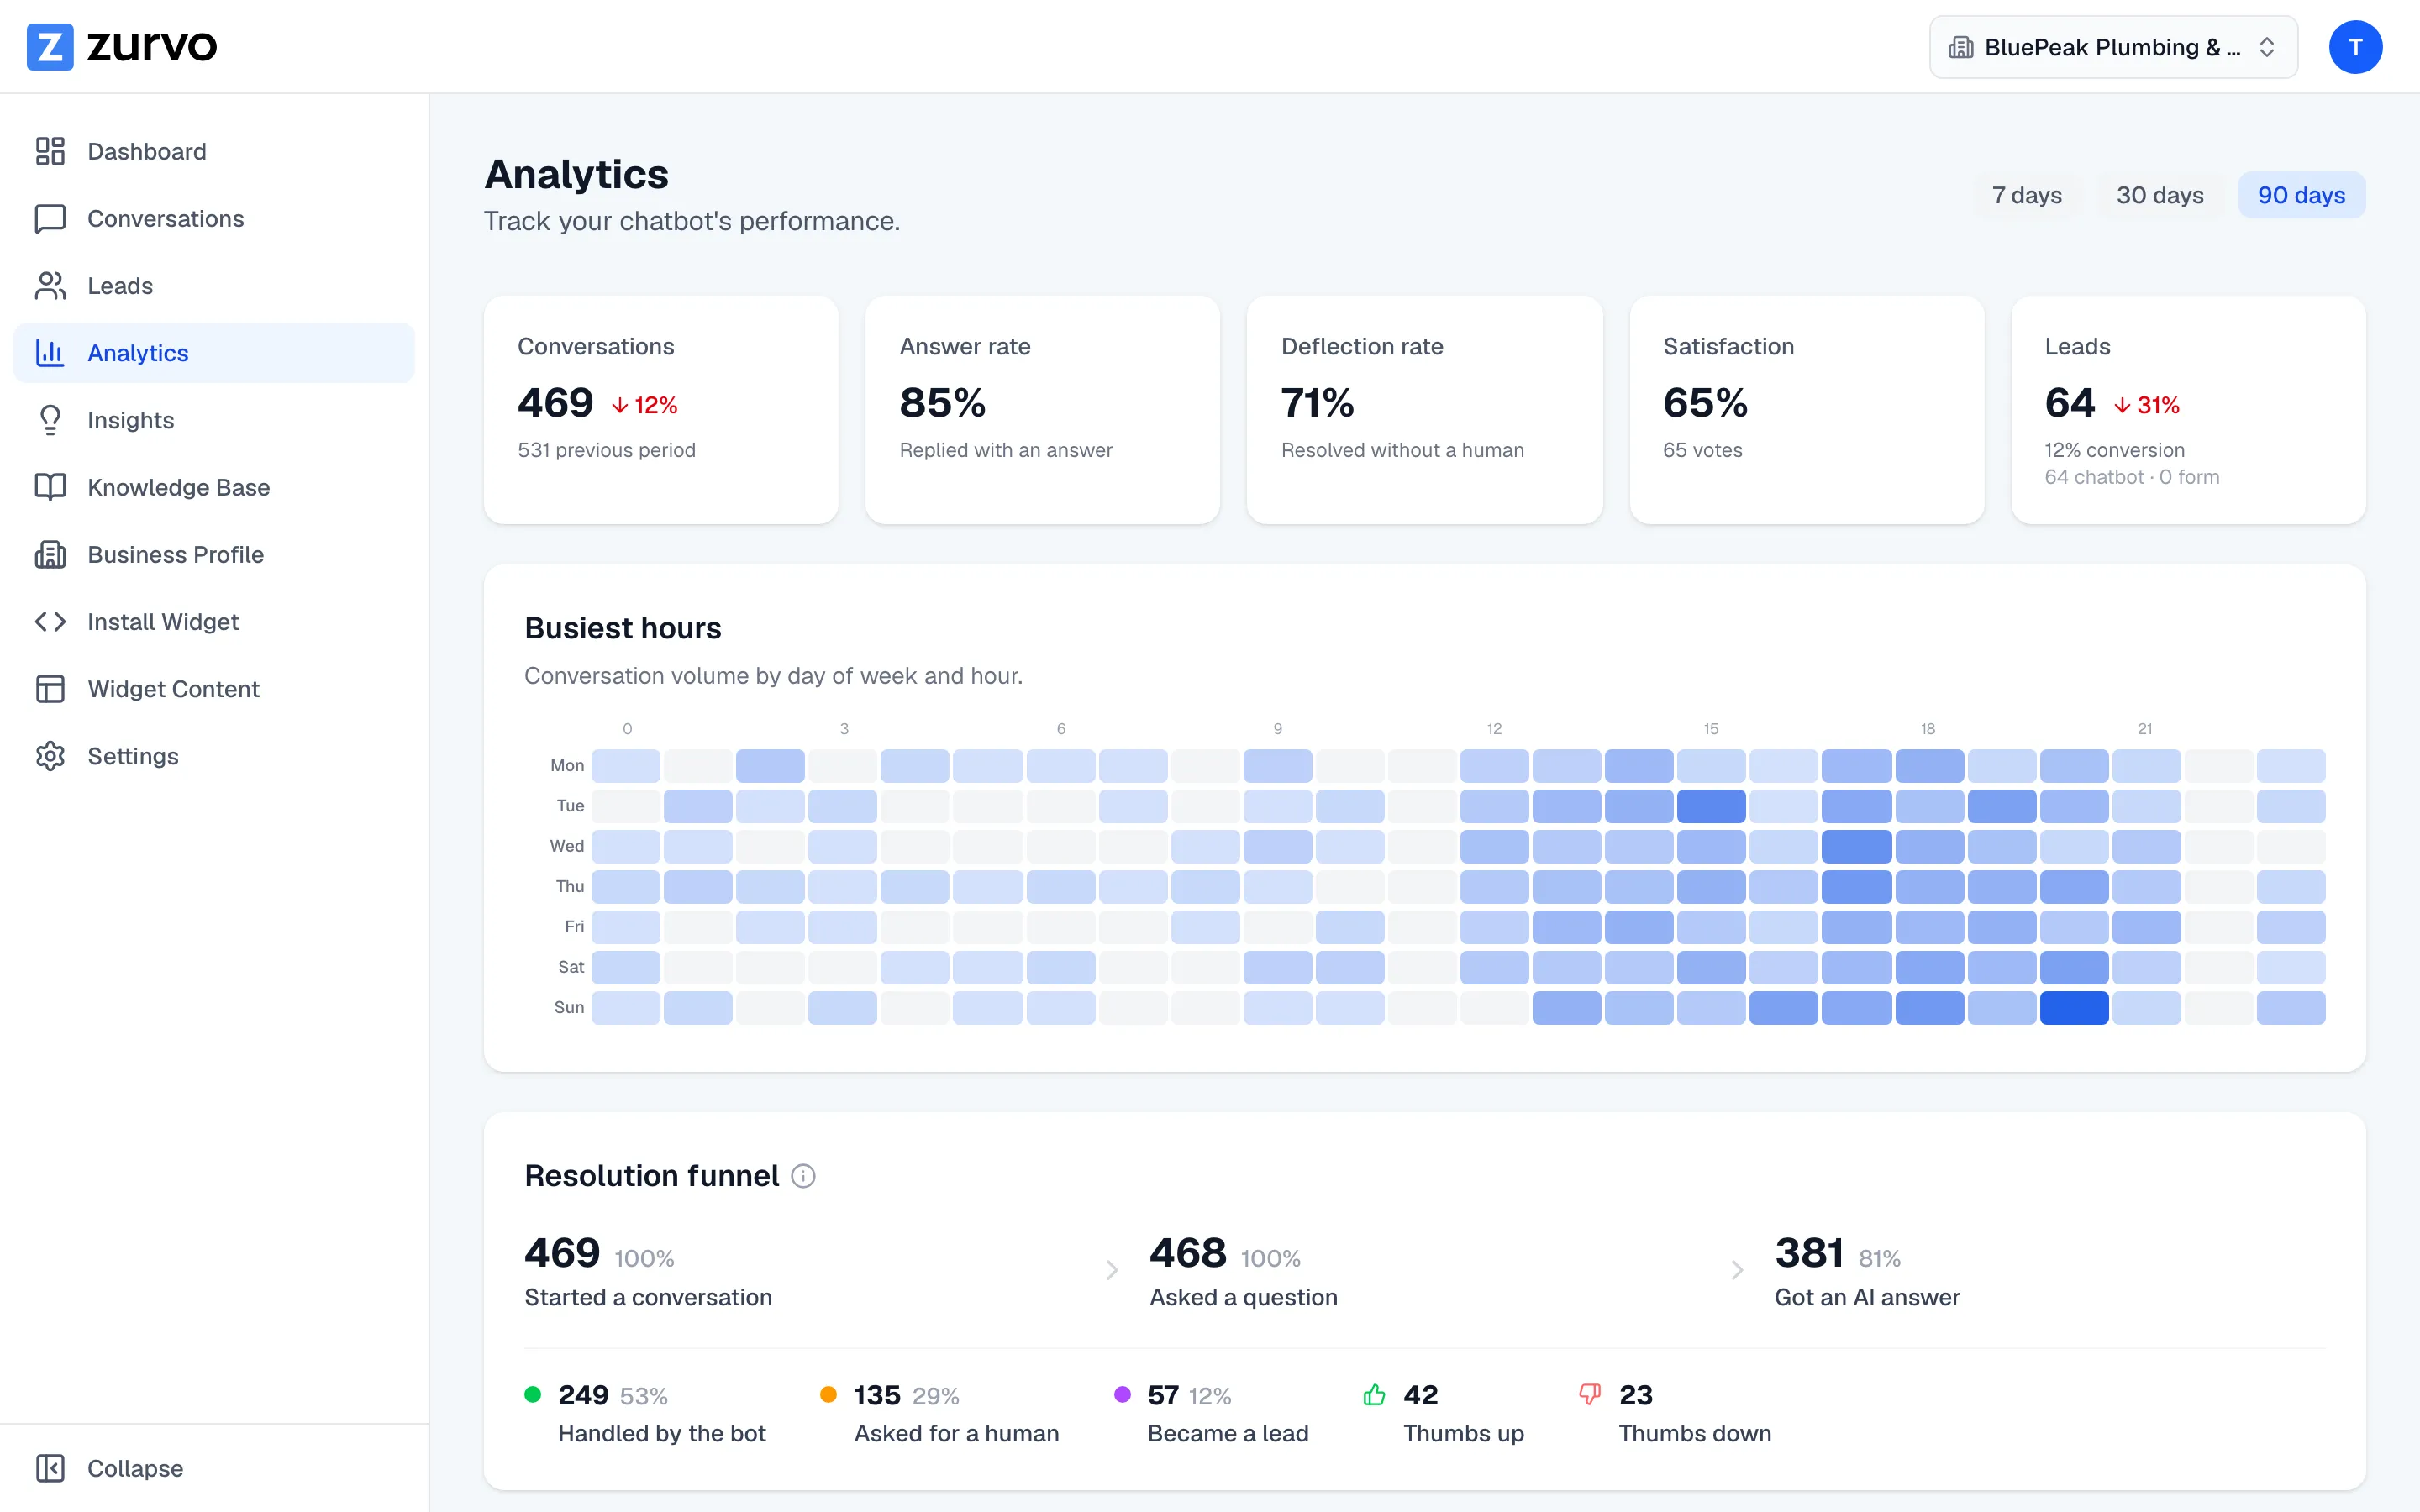
The Analytics page tracks your chatbot’s performance so you can see what’s working at a glance. Pick a time window, read the top-line numbers, and dig into the charts.
Choose your time window
At the top of the page, choose 7 days, 30 days, or 90 days. Everything on the page updates to that window, and the Conversations and Leads cards show how you’re trending versus the previous period of the same length — an up or down arrow tells you the direction at a glance.
The headline metrics
A row of cards summarizes the essentials:
- Conversations — how many chats your chatbot had, with the change from the previous period.
- Answer rate — the share of conversations it replied to with an answer.
- Deflection rate — the share it resolved without a human stepping in.
- Satisfaction — the share of visitor ratings that were positive, with the number of votes (or “No ratings yet” when there aren’t any).
- Leads — how many leads were captured, the conversion rate, and the split between leads from chat and leads from the form.
Charts and trends
Below the headline numbers, the page charts the details:
- Conversations over time — a day-by-day bar chart of chat volume, so you can spot busy stretches and quiet ones.
- Answer quality — each day’s replies split into answered, weak, and abstained, so you can see whether your chatbot is answering well or struggling.
- Busiest hours — a heatmap of conversation volume by day of week and hour, showing when your visitors are most active.
- Top unanswered questions — the gaps that came up most, with a link straight to the full Insights queue.
Hover any bar or cell to see the exact numbers behind it.
When there’s no data yet
If your chatbot hasn’t had conversations in the selected window, the page shows a “Not enough data yet” message with a button to install the widget — the numbers start filling in as soon as visitors begin chatting. And if the data ever fails to load, you’ll see a short error with a Try Again button rather than an empty page.
Where to go next
Analytics tells you how much and how well; Insights tells you what to fix. To keep an eye on your plan’s limits, see Usage and quota.
